The NVIDIA GeForce RTX 3080 easily beats the RTX 2080 across all games and synthetic benchmarks by about 30-70 per cent. In some titles, it events goes ham and achieves 2x the performance. So there's little need to worry over there. It's even cooler than previous gen reference cards. So there's little reason to skip this generation. If you're looking for a flagship GPU to own, this is it. We're still going to wait for the AMD RDNA GPUS in the form of the RX 6000 series but by the looks of it, AMD has a tough job if it wants the performance crown.
After two whole years, we're looking at the next major GPU launch cycle with NVIDIA Ampere RTX 30 series and AMD's RDNA2 RX 6000 cards right around the corner. During launch, NVIDIA CEO showcased the new Ampere cards while claiming 2x performance and 1.9x greater performance-per-watt over the older Turing RTX 20-series cards. We're going to be looking at the RTX 3080 today since that's the first Ampere card to be launched with the RTX 3090 coming within two weeks from now and the RTX 3070 coming later in October. At Rs 71,000 it has the same launch price as the RTX 2080, the RTX 3080 doesn't have to convince gamers. It supposedly even beats the RTX 2080 Ti which costs a lot more but by what margin? Let's figure that out.
NVIDIA GeForce RTX 3080 SpecificationsThe specifications for the three RTX 30 cards when compared to their RTX 20 counterparts let you know exactly how they are positioned. With 24 GB of memory, the RTX 3090 is akin to the RTX TITAN and would be targeted at workstations and multitasking machines which require a lot of CUDA cores. Whereas, the RTX 3080 and RTX 3070 are very much similar to the RTX 2080 and RTX 2070 in terms of positioning. Which bears the question, what's the equivalent for the RTX 2080 Ti? It would appear that NVIDIA is holding back till AMD's RDNA2 "Big Navi" cards are released in November 2020. We should hopefully see RTX 3080 Ti or Super cards that equal or beat the RDNA cards as a reaction to AMD's cards.

We have featured some of the GTX 10 series cards along with most of the RTX 20 series cards including the Super cards. A few AMD RX 5000 series cards were also thrown into the mix to see how good the cards perform against the competition. With AMD’s Big Navi around the corner, it’ll be great to see how these RTX 30 cards and RDNA2 cards go up against each other. Like always, we have a section for synthetic benchmarks as well as gaming benchmarks with plenty of charts to showcase differences. Coming to the rig, this is what we’re running our benchmarks on.
Processor - Intel Core i9-10900K CPU-Cooler - Noctua NH-D15 Motherboard - ASUS ROG MAXIMUS XII EXTREME RAM - 2x 16 GB Corsair Dominator Platinum @ 3200 MHz SSD - Kingston KC2500 1TB + WD Blue 1 TB PSU - Cooler Master V1200
Graphics cards: RTX 3080 RTX 2080 Ti RTX 2080 Super RTX 2080 RTX 2070 Super RTX 2070 RTX 2060 Super RTX 2060 GTX 1080 Ti GTX 1080 AMD RX 5700 XT AMD RX 5700 AMD RX 5600 XT Some of these cards were sourced from friends owing to the fact that the current lockdown situation has made it extremely difficult to get graphics cards in time for the benchmarks. Let's start with the synthetic benchmarks.
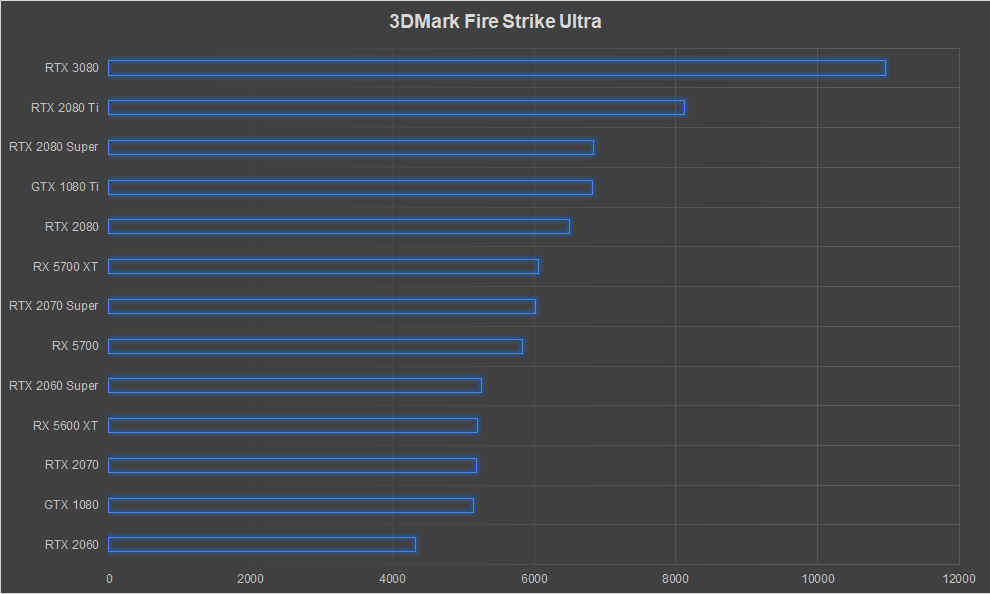
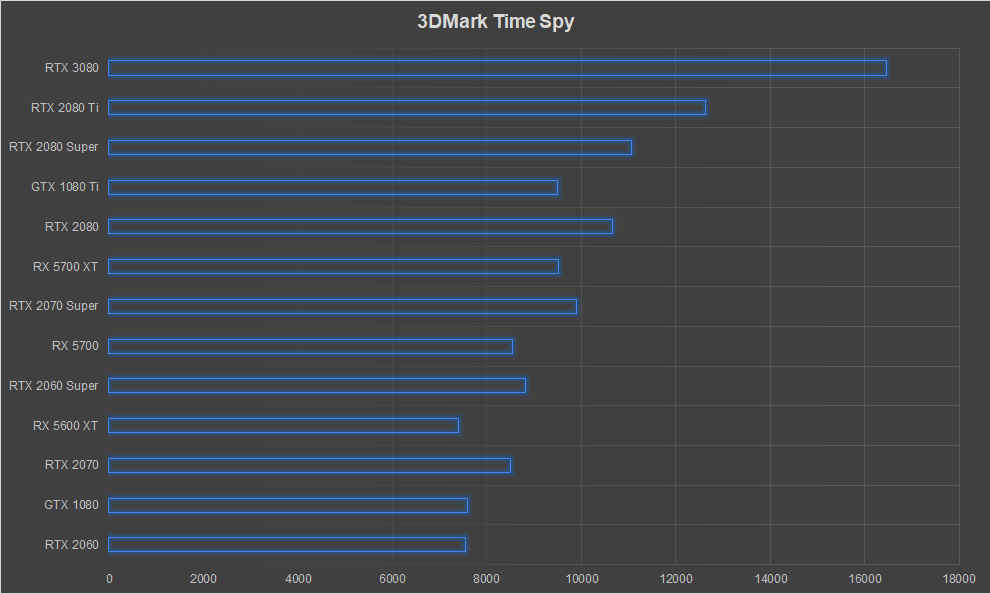
3DMark In 3DMark, we prefer the Fire Strike Ultra benchmark since the Extreme and normal runs have started producing ridiculous scores with newer GPUs. The other benchmark within 3DMark which we use is Time Spy and we run both, the normal run and the extreme run. Here, we’re showcasing Fire Strike Ultra and Time Spy scores. The RTX 3080 scores 10959 in 3DMark Fire Strike Ultra which puts it 68.4 per cent ahead of the RTX 2080 and 35 per cent ahead of the RTX 2080 Ti
Time spy shows a slightly conservative figure with a 54.5 per cent lead over the RTX 2080 and a 30 per cent lead over the RTX 2080 Ti. Did we say conservative? We should have said “relatively conservative”.
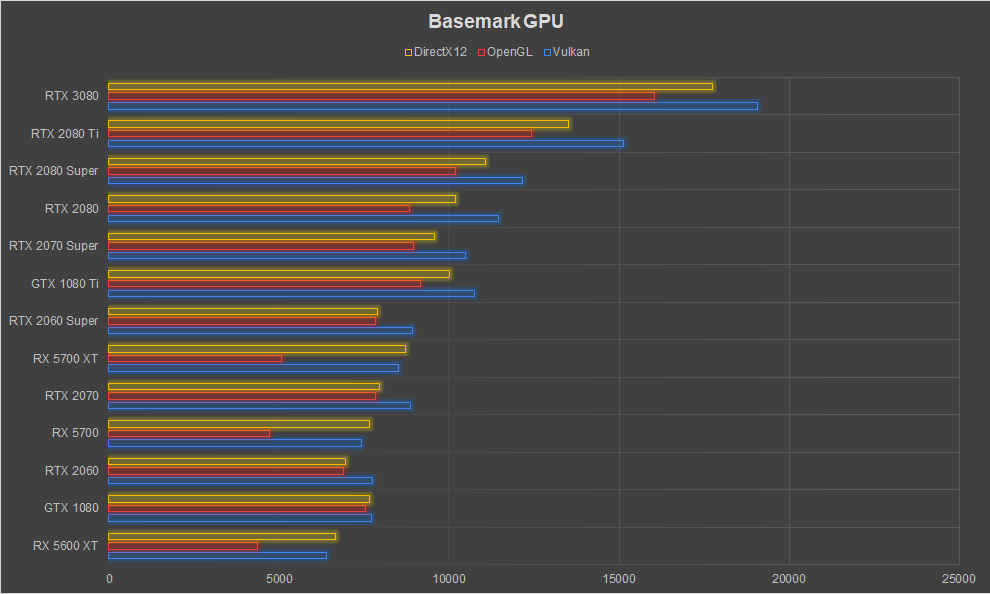
Basemark GPU Basemark GPU is a nice benchmark to compare the performance of different graphics APIs between cards. We can use the same textures with OpenGL, Vulkan and DirectX 12 to see if the graphics card excels at any particular API more than the rest or if the performance is consistent across the board. The RTX 3080 achieves scores that are between 66-81 per cent greater than the RTX 2080 and about 26-31 per cent greater than the RTX 2080 Ti. Surprisingly, Ampere’s OpenGL performance has improved the most with DX12 coming in at second and Vulkan bringing in the rear.
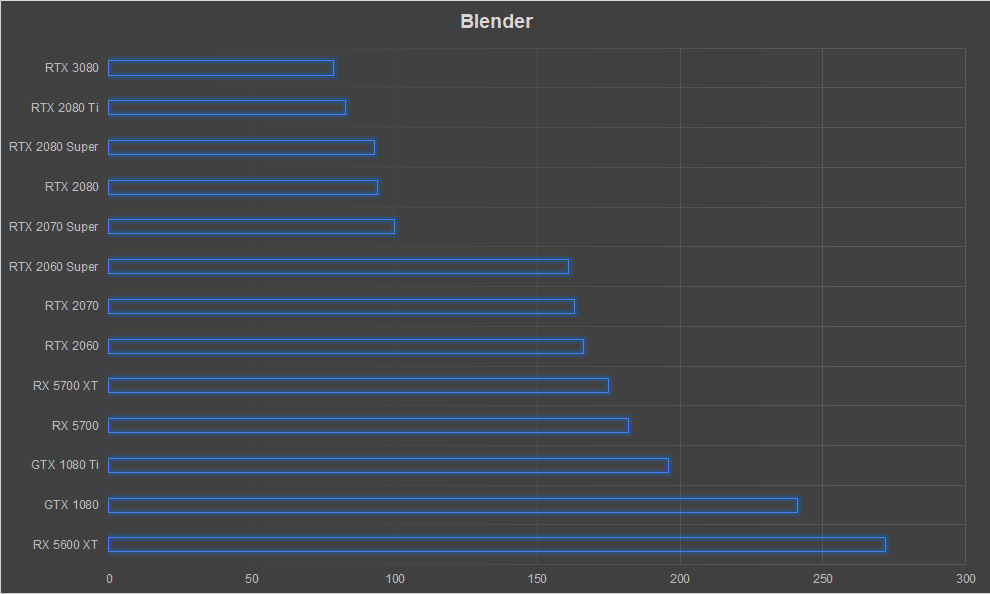
Blender Blender is a great 3D modeling and animation software that’s open-source and it is the preferred tool for folks wanting to get their hands dirty with 3D modeling. We use version 2.8 to keep up with legacy scores that we have for older cards. The latest stable version would be 2.9 and it’s an incremental upgrade. We use the classroom scene since that’s capable of utilising the GPU for rendering the scene aside from the CPU. The RTX 3080 finished the scene in 1m 18s which is a decent 4 seconds lesser than the RTX 2080 Ti. As for the RTX 2080, it renders the scene in about 94 seconds so that’s a 16 second lead for the RTX 3080.
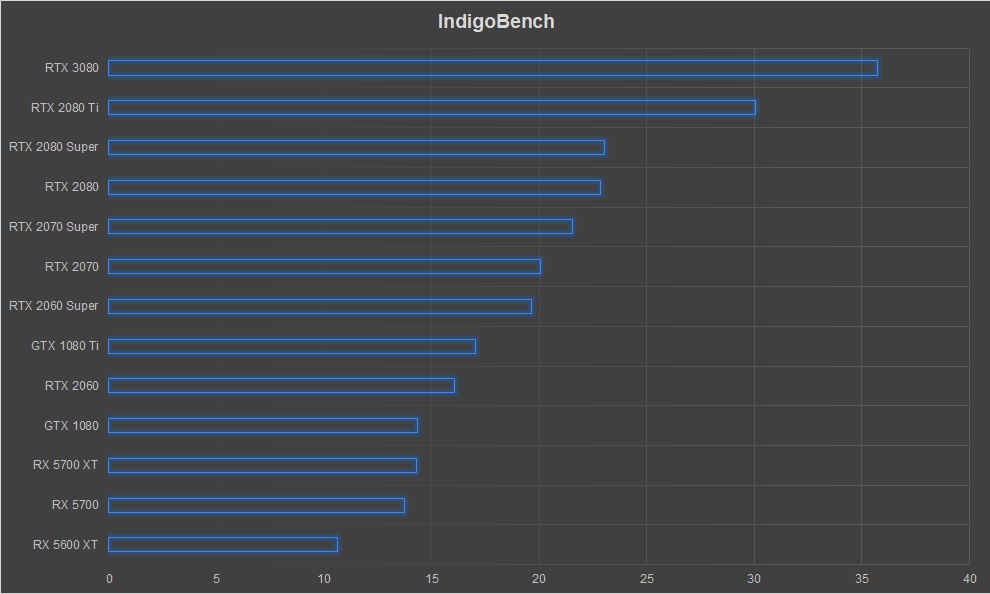
IndigoBench This is the latest synthetic to be added to our test suite. IndigoBench is based on the Indigo 4 rendering engine that’s available for popular software such as SketchUp, Blender, 3ds Max, Cinema 4D, Revit and Maya. It uses OpenCL and can benchmark both, the CPU and GPU together or individually. We prefer to test just the GPU with the software and the score provided is in terms of .M samples/s’. The RTX 3080 clocked in at 35.751 M Samples/sec which is about 18.9 per cent more than the RTX 2080 Ti and 56.4 per cent more than the RTX 2080.
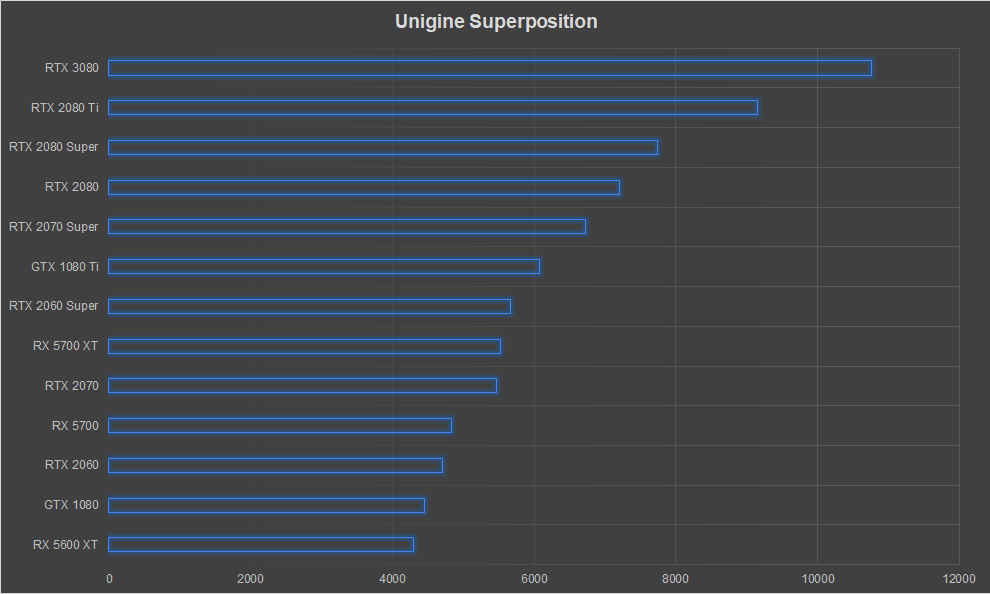
Unigine SuperPosition Unigine SuperPosition is the other popular DX11 benchmark which we prefer to use alongside 3DMark. We run it on the Extreme Quality preset and use the score metric for delineating the performance between graphics cards. The RTX 3080 performs 17.5 per cent better than the RTX 2080 Ti and 49 per cent better than the RTX 2080.
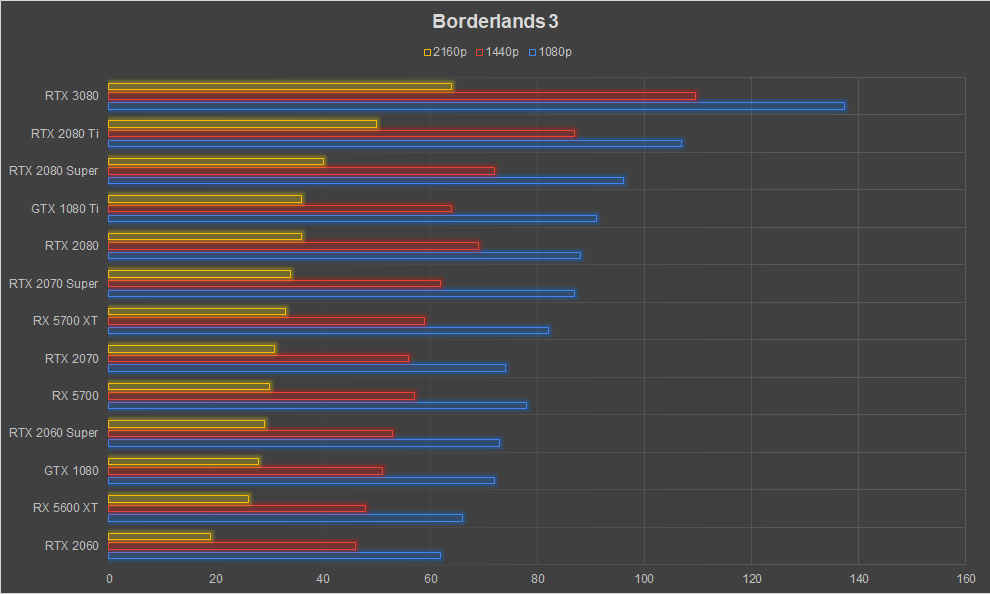
Borderlands 3 Gearbox’s latest game in the Borderlands franchise which uses Unreal Engine 4 and allows you to switch between DirectX 11 and 12. The game has an inbuilt benchmark which takes you through an array of stressful scenarios. The DirectX 12 version is quite flaky and we prefer to use the DirectX 11 API while benchmarking the game and all our existing data is based off the DX11 version so there’s no point switching now. In Borderlands 3, the RTX 3080 performs about 25-28 per cent better than the RTX 2080 Ti and about 56-58 per cent better than the RTX 2080. This is a pretty sizable jump in performance.
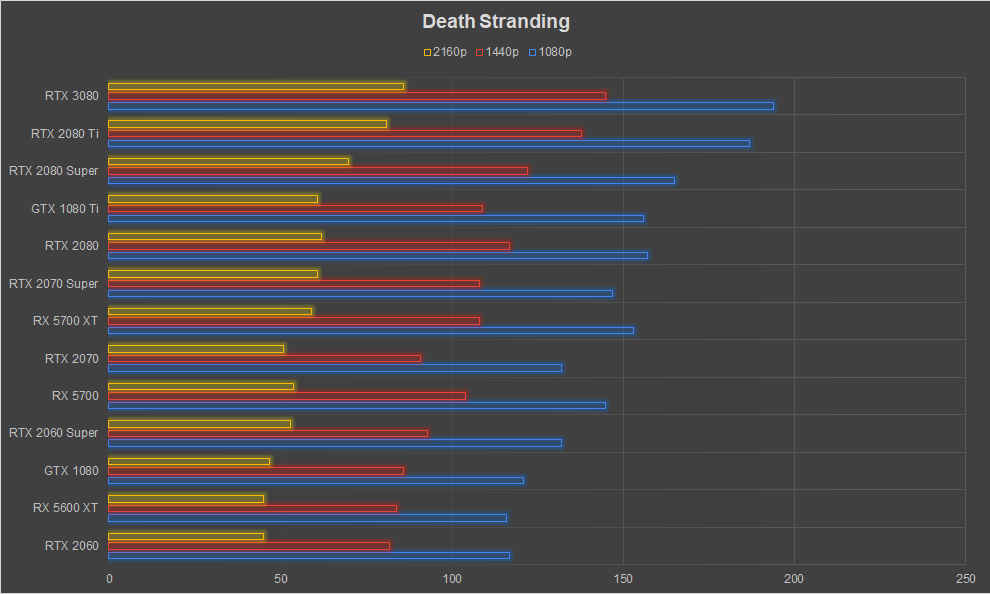
Death Stranding Hideo Kojima’s Death Stranding has been a recent addition to the PC scene and had been a PlayStation exclusive until July 2020. Being a console game, the game engine is quite optimised to make use of the scarce resources one gets with consoles. However, when 505 Games ported the game to PC, you wouldn’t end up calling the game a console port. The Decima game engine is capable of rendering up to 4K and can use high dynamic-range imaging and is also geared for the upcoming next-gen PlayStation console. It’s also the same engine used by Horizon Zero Dawn. We saw the RTX 3080 perform about 23 per cent better than the RTX 2080 at 1080p and 1440p and about 11-15 per cent better than the RTX 2080 Ti.
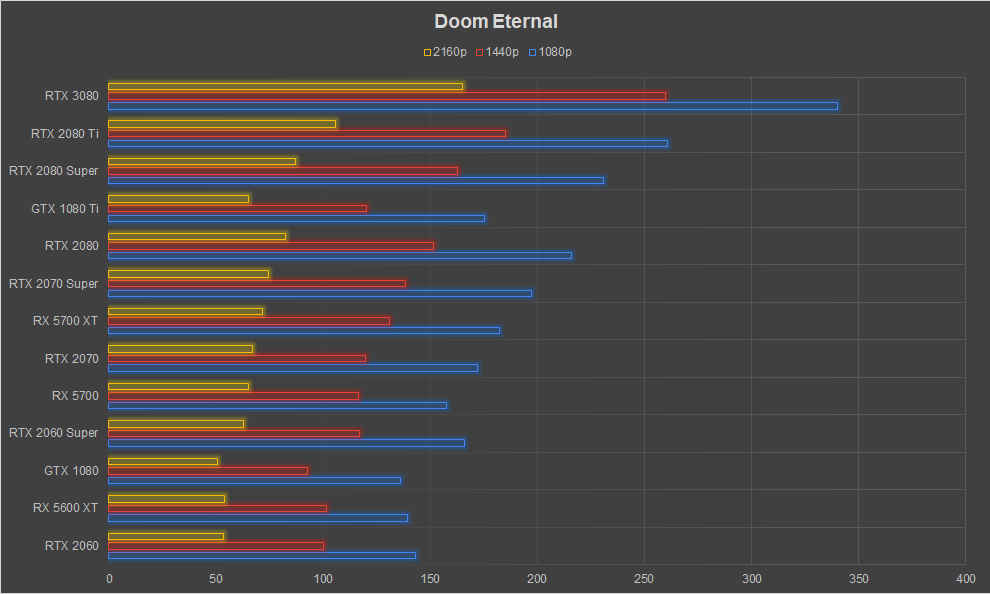
Doom Eternal Doom Eternal takes the story forward from the 2016 DOOM and it does it in spectacular fashion. It’s also one of the new games to incorporate ray-tracing as an update. The game is based on the latest Id Tech 7 game engine from Bethesda and is tremendously optimised for current gen hardware. Unlike the previous DOOM which allowed you to choose between DirectX and Vulkan, Doom Eternal is locked to Vulkan and makes use of RTX to level-up the ingame visuals. We keep the FOV at default with all the other graphics settings cranked up to Ultra Nightmare. Motion Blur is switched off across all runs because it takes away from the visual fidelity and makes running a benchmark kinda pointless. Performance metrics for Doom Eternal put the RTX 3080 a good 2x over the RTX 2080 and 1x over the RTX 2080 Ti. And we’re talking 4K here. With 1080p resolution, the FPS values are so high that the difference isn’t clear. We averaged a 57 per cent improvement over the RTX 2080 at 1080p. And compared to the RTX 2080 Ti, it was 30 per cent better at 1080p.
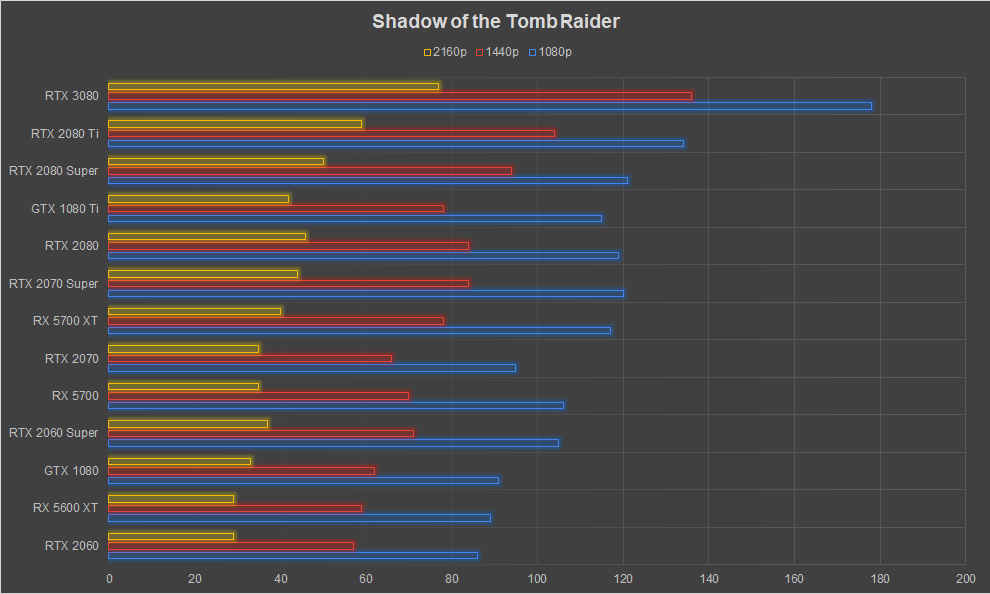
Shadow of the Tomb Raider We run Shadow of the Tomb Raider in DirectX12 mode. It ends up consuming a little more memory as most games that support both DirectX 11 and DirectX 12. The preset is set to the highest quality and HBAO+ enabled. The ingame benchmark tool takes us through several scenes which feature open spaces as well as closed spaces with lots of world detail aside from the central character. The RTX 3080 performs about 61-67 per cent better than the RTX 2080 at 1440p and 2160p resolutions, whereas on 1080p, it ends up performing about 49 per cent better than the RTX 2080. When compared against the RTX 2080 Ti, we see the performance difference drop to about 30 per cent.
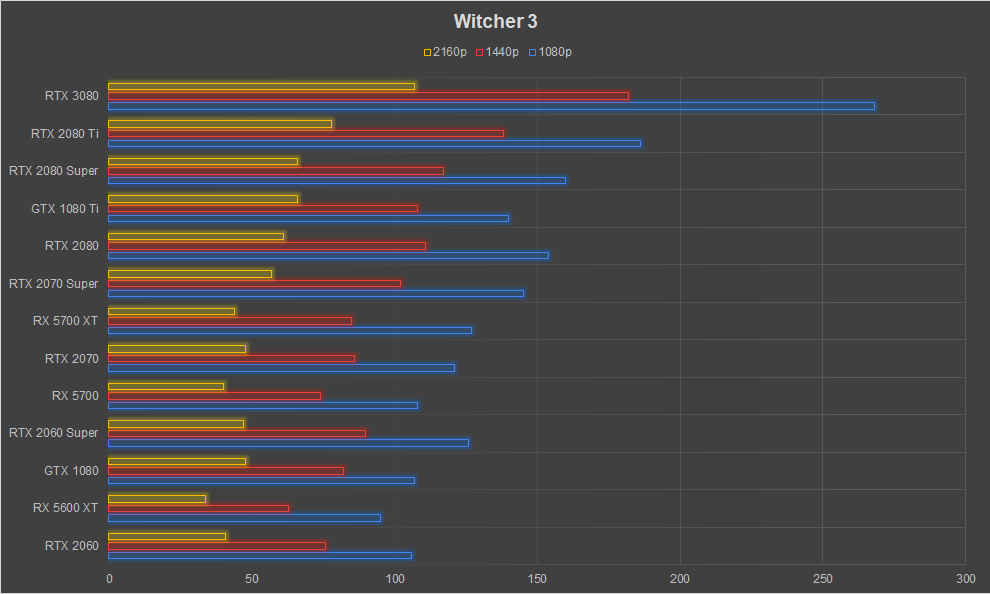
The Witcher 3 The Witcher 3: Wild Hunt is yet another game wherein we can see the generational improvements quite clearly as the game is still capable of stressing the top-end graphics cards. This seems to be changing of late as the RTX 3080 ended up getting 107 FPS at 4K with the ultra preset. We do switch off NVIDIA Hairworks in our bench runs since it’s a proprietary NVIDIA feature and that messes up the performance measurements between AMD and NVIDIA cards. When compared with the RTX 2080, we see that the RTX 3080 is approximately 74 per cent better in 1080p, 1440p and 2160p benchmarks. And when compared to the RTX 2080 Ti, which is the more appropriate comparison till it gets trumped later on, the RTX 3080 performs about 37-44 per cent better.
The Founders Edition NVIDIA GeForce RTX 3080 will be priced at Rs 71,000 in India. The RTX 3080 and RTX 3070 pricing seem to be similar to the launch prices for their RTX 20 counterparts. Launch price for the RTX 2080 Ti Founder’s Edition was Rs 1,02,500 and the RTX 2080 started off for Rs 68,500 and lastly, the RTX 2070 was priced at Rs 51,200.
BottomlineThe NVIDIA GeForce RTX 3080 easily beats the RTX 2080 across all games and synthetic benchmarks by about 30-70 per cent. In some titles, it events goes ham and achieves 2x the performance. So there's little need to worry over there. It's even cooler than previous gen reference cards. So there's little reason to skip this generation. If you're looking for a flagship GPU to own, this is it. We're still going to wait for the AMD RDNA GPUS in the form of the RX 6000 series but by the looks of it, AMD has a tough job if it wants the performance crown.
from Latest Technology News https://ift.tt/2Rz6Ai6


No comments:
Post a Comment